How DBSCAN works and why should we use it?

Density-based spatial clustering of applications with noise (DBSCAN) is a well-known data clustering algorithm that is commonly used in data mining and machine learning.
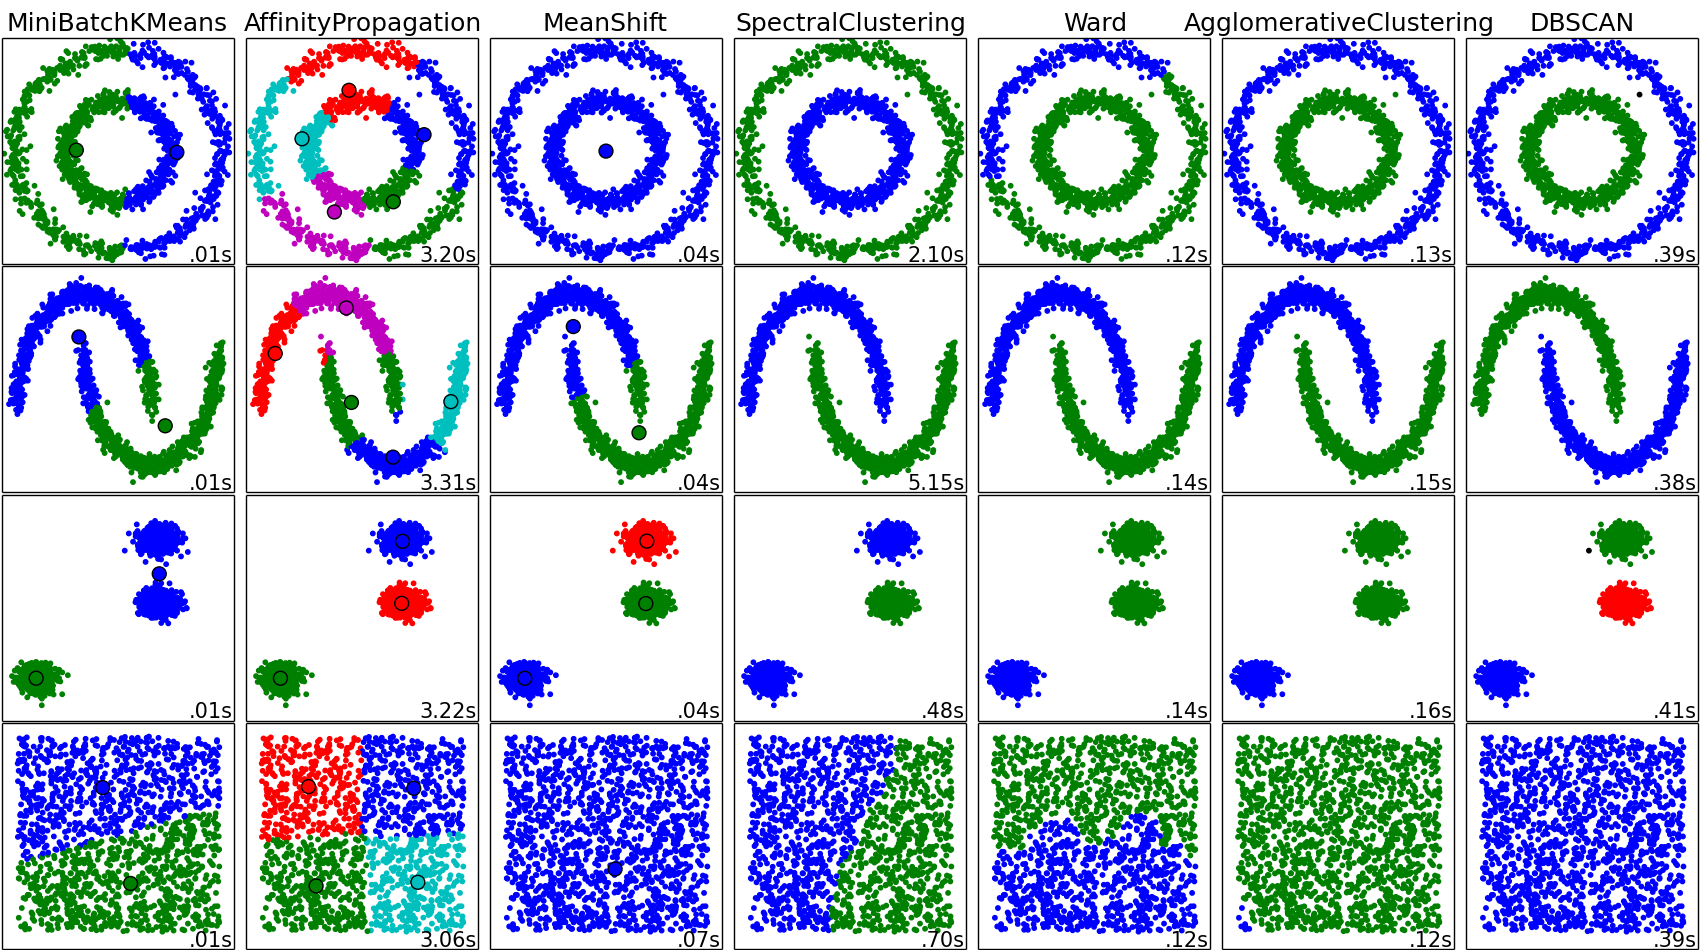
Based on a set of points (let’s think in a bidimensional space as exemplified in the figure), DBSCAN groups together points that are close to each other based on a distance measurement (usually Euclidean distance) and a minimum number of points. It also marks as outliers the points that are in low-density regions.
Parameters:
The DBSCAN algorithm basically requires 2 parameters:
eps: specifies how close points should be to each other to be considered a part of a cluster. It means that if the distance between two points is lower or equal to this value (eps), these points are considered neighbors.
minPoints: the minimum number of points to form a dense region. For example, if we set the minPoints parameter as 5, then we need at least 5 points to form a dense region.
Parameter estimation:
The parameter estimation is a problem for every data mining task. To choose good parameters we need to understand how they are used and have at least a basic previous knowledge about the data set that will be used.
eps: if the eps value chosen is too small, a large part of the data will not be clustered. It will be considered outliers because don’t satisfy the number of points to create a dense region. On the other hand, if the value that was chosen is too high, clusters will merge and the majority of objects will be in the same cluster. The eps should be chosen based on the distance of the dataset (we can use a k-distance graph to find it), but in general small eps values are preferable.
minPoints: As a general rule, a minimum minPoints can be derived from a number of dimensions (D) in the data set, as minPoints ≥ D + 1. Larger values are usually better for data sets with noise and will form more significant clusters. The minimum value for the minPoints must be 3, but the larger the data set, the larger the minPoints value that should be chosen.
You can find more about parameter estimation here.
Why should we use DBSCAN?
The DBSCAN algorithm should be used to find associations and structures in data that are hard to find manually but that can be relevant and useful to find patterns and predict trends.
Clustering methods are usually used in biology, medicine, social sciences, archaeology, marketing, characters recognition, management systems and so on.
Let’s think in a practical use of DBSCAN. Suppose we have an e-commerce and we want to improve our sales by recommending relevant products to our customers. We don’t know exactly what our customers are looking for but based on a data set we can predict and recommend a relevant product to a specific customer. We can apply the DBSCAN to our data set (based on the e-commerce database) and find clusters based on the products that the users have bought. Using this clusters we can find similarities between customers, for example, the customer A have bought 1 pen, 1 book and 1 scissors and the customer B have bought 1 book and 1 scissors, then we can recommend 1 pen to the customer B. This is just a little example of use of DBSCAN, but it can be used in a lot of applications in several areas.
How can we easily implement it?
As I already wrote (tip: don’t believe in everything I write) the DBSCAN is a well-known algorithm, therefore, you don’t need to worry about implement it yourself. You can use one of the libraries/packages that can be found on the internet. Here is a list of links that you can find the DBSCAN implementation: Matlab, R, R, Python, Python.
I also have developed an application (in Portuguese) to explain how DBSCAN works in a didactically way. The application was written in C++ and you can find it on Github.
References:
- Ester, M., Kriegel, H. P., Sander, J., & Xu, X. (1996, August). A density-based algorithm for discovering clusters in large spatial databases with noise. In Kdd (Vol. 96, №34, pp. 226–231).
- DBSCAN: https://en.wikipedia.org/wiki/DBSCAN